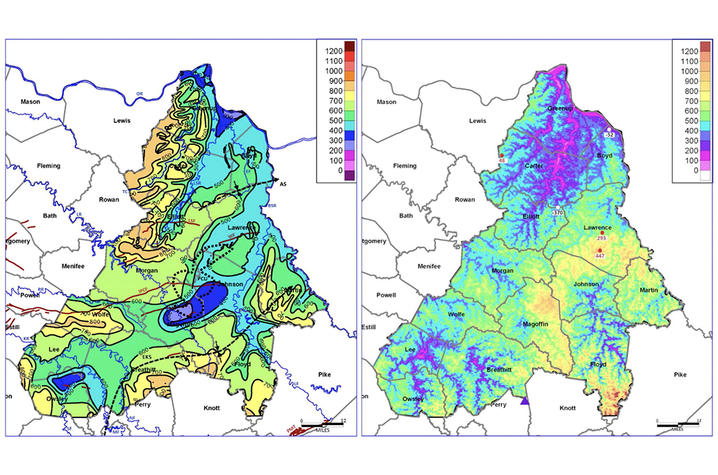
New KGS Publication Can Help Protect Groundwater in Oil and Gas Drilling Areas

In 2011, exploration for oil and gas began to increase in the Berea sandstone of northeastern Kentucky, with the drilling of numerous relatively shallow horizontal wells (less than 2,000 feet deep) and the use of hydraulic fracturing to recover the resources. The shallow drilling depths and completion practices prompted concern about the potential for contamination of groundwater, which can be the source of drinking water for humans and livestock in the area. Historically, the maximum depth at which fresh groundwater might be encountered in Kentucky has been based on the 1966 H.T. Hopkins publication, “Fresh-Saline Water Interface Map of Kentucky.” The Hopkins map has been the standard reference used by many oil and gas operators and regulatory agencies for determining how deep surface casing should be placed to protect groundwater.
New analysis from the Kentucky Geological Survey (KGS), a research center within the University of Kentucky, however, indicates the Hopkins map underestimates the maximum depth of fresh groundwater in most areas. As reported in the publication, “Using Watershed Pour-Point Elevations to Evaluate the Base of Fresh Groundwater in the Cumberland Plateau of Eastern Kentucky,” the analysis by KGS' Ethan Davis, Marty Parris and Jerrad Grider shows that fresh water can extend hundreds of feet deeper than depicted on Hopkins’ 1966 map. As interest in the Berea play increased, Parris says, he noticed that the assumptions used in making the Hopkins map were too basic, and that Hopkins did not have the larger amount of information now available in the Kentucky Groundwater-Quality Database, managed by KGS.
Davis, the main author of the new publication, came to KGS as a student worker in 2015 and began working with Parris on the issue.
“We started looking at domestic water wells, because we have so much more water data today than Hopkins had," Davis said. "In the 14 counties where our study takes place, Hopkins used 50 wells for his map, whereas we have records on more than 4,800.”
In an effort to use only the deepest wells for estimating the maximum depth of fresh groundwater, Davis used several analytical methods to filter out shallower water wells that were producing a lot of noise in the data.
“So we started talking to the people in the Water Resources Section, and they suggested we start looking at the hydrologic unit codes, which are USGS-defined drainage basins of various sizes," Davis said. "That proved to be our most successful route.”
Parris says the “lightbulb” moment in the research came when they recognized that every drainage basin has a lowest point — the pour point — where surface water empties from the basin. In areas of groundwater recharge, Davis explains, it is highly likely that there is fresh groundwater at elevations lower than that of the pour point. That realization helped them to eliminate the shallower wells, leaving 74 deeper wells to indicate how deep the fresh water can actually be. The new analysis showed that the deepest observed fresh groundwater is, on average, 147 feet deeper than the estimates on the Hopkins map. The depth is as much as 500 feet deeper in eastern Lawrence County.
Davis and Parris are confident that their analysis and maps contained in the new publication provide a more accurate assessment of the maximum depth of fresh groundwater. They note, however, that the interface between the fresh and saline water should be seen as a transition zone, and there could be fresh groundwater deeper than estimated in this study. That continued uncertainty is why the term “observed” was applied to the new maps they developed. They anticipate that their method may be more broadly applied across the state to reassess the maximum depth of fresh groundwater.
Credits
Text by Mike Lynch (Kentucky Geologic Survey).

